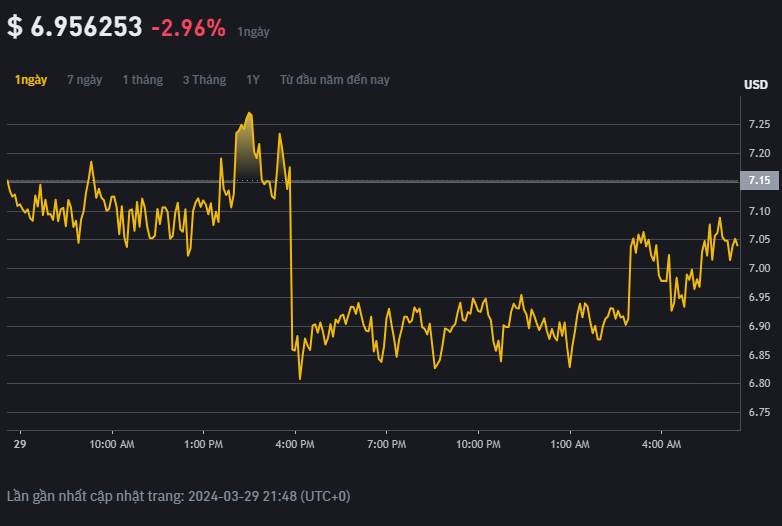
Holdstation (HOLD) pulsates at the heart of the Holdstation decentralized exchange (DEX), a revolutionary platform built on zkSync Era. This innovative DEX empowers users with a secure, fast, and cost-effective avenue for trading cryptocurrencies. HOLD serves as the lifeblood of the Holdstation ecosystem, functioning as a utility token with a multitude of functionalities, including:
- Transaction Fee Discount: Users leverage HOLD to enjoy significant savings on transaction fees incurred on Holdstation.
- Governance Participation: HOLD holders have the privilege of voting on critical decisions that shape the future of the Holdstation platform.
- Staking Rewards: Users can stake their HOLD tokens to earn attractive rewards.
- Program Eligibility: HOLD serves as a gateway to exclusive promotions, airdrops, and other activities organized by Holdstation.
For anyone interested in Holdstation and its potential, understanding the price movements, chart behavior, and market capitalization of HOLD is paramount. This comprehensive exploration delves into all aspects of HOLD price, equipping you with the knowledge required to navigate the dynamic world of cryptocurrency.

Unveiling the Price Veil: Factors Influencing HOLD
The price of HOLD is a dynamic entity, constantly fluctuating based on the interplay of supply and demand across various cryptocurrency exchanges. Several key factors influence the price of HOLD, shaping its upward and downward trends:
- Supply and Demand Dynamics: The fundamental principle of supply and demand dictates the price of HOLD. When the demand to acquire HOLD surpasses the available supply, the price of HOLD tends to rise. Conversely, when an influx of users sell their HOLD tokens, exceeding the buying pressure, the price experiences a downward trajectory.
- The Broader Cryptocurrency Market: The price of HOLD can also be significantly impacted by the overall sentiment within the cryptocurrency market. When Bitcoin, the leading cryptocurrency, and other prominent players experience price surges, the price of HOLD might follow suit, and vice versa. Positive news or developments within the broader market can instill confidence in investors, potentially leading to increased demand for HOLD and a subsequent price increase. Conversely, negative sentiment or events in the cryptocurrency market can trigger a sell-off, driving down the price of HOLD.
- Holdstation-Specific News and Events: News and events surrounding Holdstation can significantly influence the price of HOLD. The launch of groundbreaking products, strategic partnerships with established entities, or the implementation of new governance rules can all have a substantial impact on investor sentiment and, consequently, the price of HOLD. Positive news and events can generate excitement and attract new users to the Holdstation platform, potentially leading to increased demand for HOLD and a price hike. Conversely, negative news or events can erode investor confidence, triggering a sell-off and driving down the price of HOLD.
- Circulating Supply of HOLD: The total amount of HOLD tokens actively circulating in the market can also play a crucial role in determining its price. If the circulating supply of HOLD increases significantly, due to factors like unlocking additional tokens, it can lead to a decrease in price due to dilution. Conversely, a limited circulating supply, potentially achieved through token burning mechanisms, can create scarcity, potentially driving up the price of HOLD.
Demystifying the HOLD Chart: A Guide to Price Analysis
Numerous websites and applications offer real-time price charts for HOLD. These charts serve as invaluable tools for tracking the price fluctuations of HOLD across various timeframes, such as 1 hour, 1 day, 1 week, 1 month, 1 year, or even the entire trading history. A HOLD price chart might incorporate various technical indicators, including:
- Moving Averages (MA): Moving averages smooth out price data, helping to identify potential trends and support/resistance levels.
- Bollinger Bands (BB): Bollinger Bands depict a range of volatility around a moving average. A narrowing of the bands can indicate a potential breakout, while widening bands can suggest increased volatility.
- Relative Strength Index (RSI): The RSI measures the momentum of price movements and can help identify potential overbought or oversold conditions.
By analyzing these technical indicators in conjunction with the price chart, you can gain valuable insights into potential price trends and make informed investment decisions regarding HOLD.
Read more:
Demystifying Holdstation (HOLD): A Dive into Price, Chart, and Market Capitalization
Holdstation Wallet A Secure Gateway to the Future of DeFi
Holdstation Exchange: A Decentralized Powerhouse for Crypto Trading
Decoding Market Capitalization: A Measure of HOLD’s Size
The market capitalization of HOLD is calculated by multiplying the current

